OUR NETWORK

Our network remains a material topic from a sustainability perspective because it is essential to our business. It is a fundamental aspect of our operations as all of the services we provide to our customers are delivered through the network platform. It is also the medium through which we reach stakeholders and transform lives through our wide range of products and services. The quality, coverage and availability of our network impacts our business as it provides us with a competitive advantage,allowing us to differentiate ourselves in a highly competitive industry.

As part of our ongoing commitment to the SDGs in the expansion and maintenance of our networks, we aligned our efforts with five of the goals during the year: fostering a conducive work environment (SDG8) by putting the safety of all staff and our partners first, by ensuring that all staff are treated equally, and by promoting and supporting Diversity and Inclusion (SDG10); entrenching the use of energy-effi cient technologies (SDG7) within our environmentally friendly installations and our facilities; and extending coverage of our services and offering an excellent network experience to society in general (SDG9).

Our network is the core of our business and the medium through which we transform lives.

KEY FOCUS AREAS DURING THE YEAR

Digital Telco migration
(using automated performance monitoring and data-driven insights to improve network)
• Net Zero by 2050
(road map of activities and targets to achieve our goal)
Converged Billing System (CBS) upgrade
(successful migration to CBS v5.5)
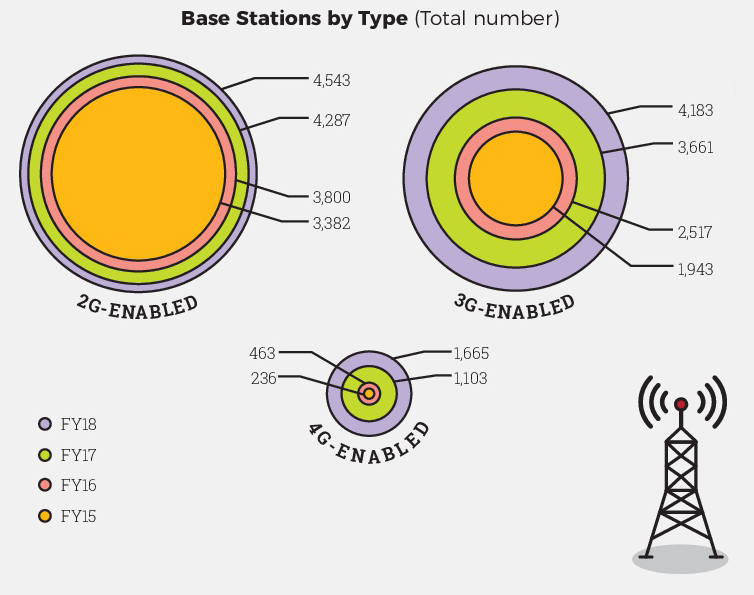
• Aggressive expansion of fibre optic network
(fast tracking budgets, securing materials on time and expanding number of partners)
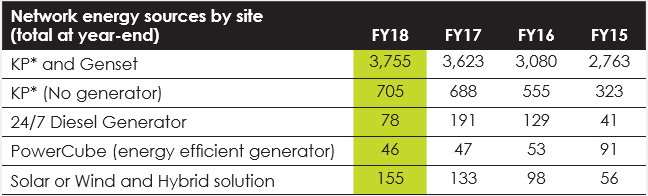
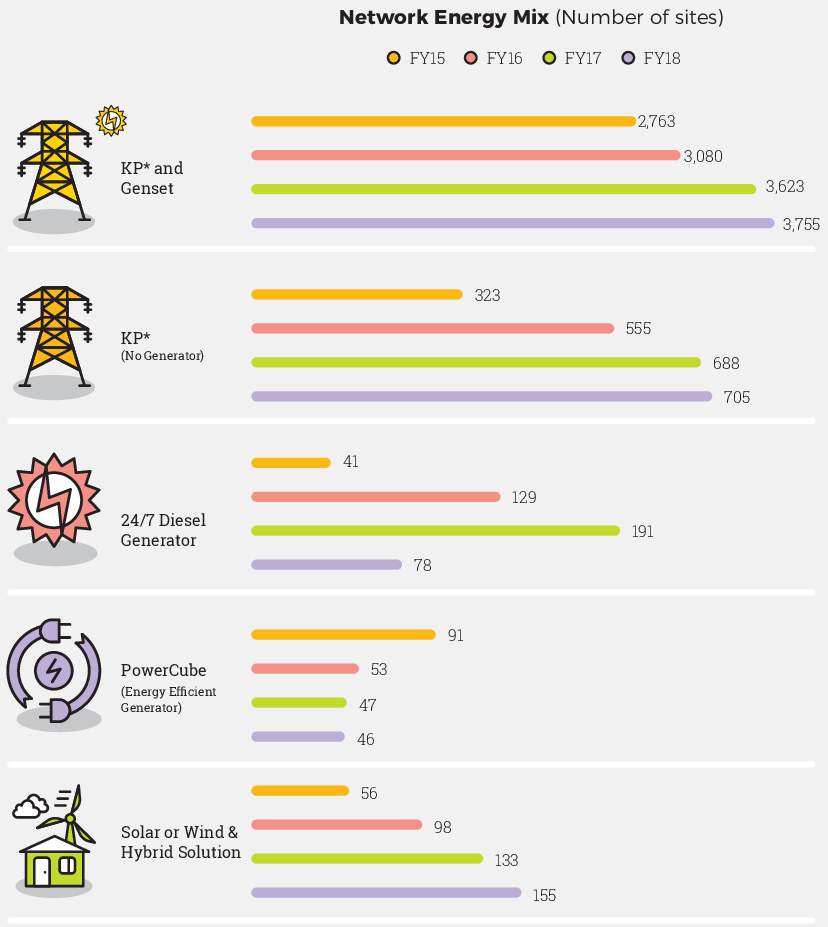
• Energy efficiency and sustainability
(optimising energy consumption patterns and focusing on sustainable energy
sources)

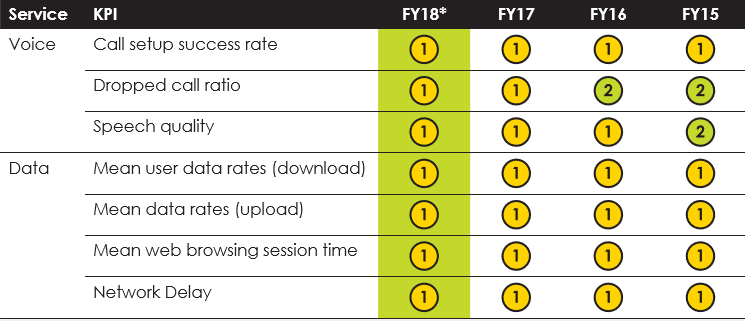
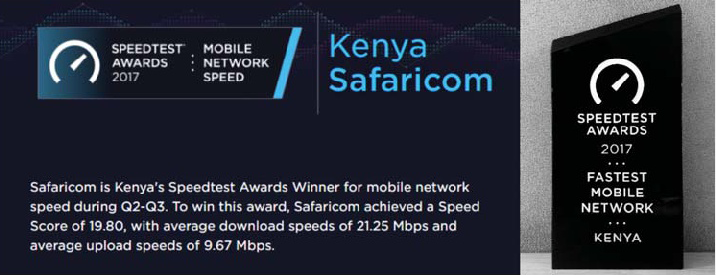
BEST NETWORK IN KENYA

Independent Quality of Service (QoS) testing is one of the main indicators we use to monitor and manage the quality of our network. We have yet to receive the results of the P3 Communications QoS tests for the period under review, but we have adopted the P3 methodology internally and have published our internal testing results using the exact same measurements in the interim.

Independent Quality of Service (QoS) test results

According to the results of our internal testing, we remained the overall leader for both voice and data among mobile operators in Kenya. As the preceding table shows, the one area where we experienced some drop in comparative performance was the ‘network delay’ measurement. While testing, high latencies (delays) were noted in 3G and lower throughputs in some of the main cities due to interference. Ongoing optimisation efforts have since resolved the pertinent issues that were, on the whole, caused by constraints on capacity.

The seven KPIs tabulated in the Quality of Service (QoS) test results table above are regarding network performance, not actual network performance. a simplified illustration of the full scope measured for the P3 Certifi cation Benchmark criteria. For the purposes of this disclosure, we have ranked ourselves against the other mobile operators in Kenya. The comprehensive P3 Certification Benchmark criteria is composed of an extensive set of 29 KPIs for ‘Big Cities’, ‘Small Cities’ and ‘Interconnecting Highways’, with each KPI having a score. The full set of P3 certification results can be obtained from the P3 website.

Fastest Mobile Network in Kenya

We are also delighted to report that we were awarded the ‘Fastest Mobile Network in Kenya’ award in October 2017 by Ookla, the company behind Speedtest.net and one of the global leaders in internet testing and analysis. Our network was rated as offering average download speeds of 21.25 Mbps and average upload speeds of 9.67 Mbps by Ookla.

CUSTOMER SATISFACTION HIGHEST IN FOUR YEARS

Another important metric we use to measure our performance is the network related Net Promoter Score (NPS). The NPS is an independent survey of customer satisfaction and the ‘Network NPS’ metric allows us to monitor whether our customers are experiencing the improvements we make to the network. While NPS is a useful indicator, it is important to note that it measures customer opinions regarding network performance, not actual network performance.

Breakdown of Network NPS

As the black line in the preceding graph shows, our overall Network NPS was 72 in March 2018, a signifi cant increase of 9 points from 63 in March 2017. The graph also illustrates the breakdown of different network elements used to determine the overall NPS. We are satisfi ed with our improved results across all of the metrics, which we attribute to increased broadband (3G and 4G) coverage and improved data speeds, as well as a successful marketing campaign that promoted the superiority of our 4G network to customers and positively changed perceptions (see the Innovation section on page 47 of this report for further detail).

CUSTOMER SATISFACTION HIGHEST IN FOUR YEARS

Another important metric we use to measure our performance is the network related Net Promoter Score (NPS). The NPS is an independent survey of customer satisfaction and the ‘Network NPS’ metric allows us to monitor whether our customers are experiencing the improvements we make to the network. While NPS is a useful indicator, it is important to note that it measures customer opinions regarding network performance, not actual network performance.

Customer billing upgraded

A major achievement during the year was the successful upgrade of our Converged Billing System (CBS). The large-scale upgrade involved migrating more than 35 million subscriber profi les and 2,000 products across to CBS v5.5, as well as integrating 42 external systems into the new platform overnight. The modernisation project was nicknamed Alfajiri or ‘new dawn’ in recognition of its scale and complexity and involved over 140 experts from a wide variety of disciplines.

NETWORK EXPANSION ON TRACK

We continued to make significant progress with regards to the ongoing expansion of our network during the year. The focus remained on increasing broadband coverage and we rolled out an additional 703 3G-enabled sites, many of these were in rural areas, which equates to providing an additional 1 per cent of the population with coverage. We also deployed 562 4G-enabled sites during the year. Most of these sites used the 800 MHz band to improve capacity and data speeds in major towns and, as a result, we achieved rapid growth and extended 4G services to an additional 10 per cent of the population, meeting the ambitious target we set for ourselves.

We failed to achieve our target of 4,646 2G-enabled sites due to logistical challenges and instability/security concerns in certain parts of the country, but we still deployed an additional 312 2G-enabled sites during the year and provide 96 per cent of the population with access to 2G services.

FOCUSED EXPANSION OF FIBRE OPTIC NETWORK

We are delighted to be able to report that we have made excellent progress in terms of expanding our fi bre optic network again this year, surpassing even the achievements of FY17. We laid an additional 769 kilometres of fi bre optic cables during the year and our network is now 5,469 kilometres in length and connects 72 cities in 46 counties. We have also connected 50% of our sites (BTS) to the network.

In terms of enterprise buildings, we deployed the network in three new towns during the year — Bungoma, Kitale and Nyeri — and exceeded our target of connecting 1,850 enterprise buildings connected by 72 to bring the total of connected buildings to 7,117. We were able to achieve this because partners and materials were secured early in the year and thanks to a focus on acquiring buildings during construction, which is typically a faster process than acquiring existing buildings.

In terms of residential homes, we surpassed our achievements in FY17 and passed an additional 100,000 homes. Again, this was achieved as a result of early deployment of materials, along with the on-boarding of two additional partners.

NETWORK AVAILABILITY AND STABILITY

The stability and availability of our network remains a critical necessity. Any interruption in energy supply, such as grid electricity outages and national shortages of diesel fuel, poses a direct challenge to the continuity of our operations. We continue to manage our response to this issue primarily through our Service Unavailability Rate (SUR). Our SUR is calculated by dividing the minutes of downtime per week per network element by the number of sites in our network.

As the preceding table (left) and graph (above) show, the SUR for the Radio Access Network improved slightly during the year, reducing from 22.9 minutes in FY17 to 22.2 minutes in FY18. We are not satisfied with this result, however, and will redouble our efforts to achieve a SUR of below 15 minutes in FY19. Our progress was hampered again this year by power outages and transmission failures. The network outage that occurred on 24 April 2017, when we lost connectivity into our core network as well as the redundant path, had a significant impact on our SUR. As well as improving power redundancy and backup solutions, we are renegotiating the terms of Service Level Agreements (SLAs) with contractors and service providers to ensure that transmission failures, due to fi bre cuts etc., are addressed more swiftly. Like last year, insecurity in parts of the country also had an impact on the restoration of services at remote locations.

ENERGY MIX

As reported last year, we have adjusted our approach to the mix of energy sources used throughout our network in response to the SDG strategy. Our current focus is on using sustainable energy sources and consumption patterns to achieve network availability and energy efficiency goals. In practical terms, this means avoiding, and phasing out, the use of diesel generators wherever possible, either by ensuring that Kenya Power (national grid) energy is available at a site or by employing alternative energy solutions.

As the following table shows, we signifi cantly reduced the number of sites powered 24/7 by diesel generators. This was achieved by bringing national grid energy to larger sites (that provide critical coverage) and prioritising the use of solar-based energy solutions at smaller sites (that provide additional capacity). The number of sites connected to the national grid increased by 149 and an additional 22 sites were converted to solar or wind and hybrid power solutions. While it is satisfactory progress, delays with the provisioning of commercial power smart meters and the shipping of solar equipment prevented us from achieving more.

LOOKING AHEAD

FY19 Goals

• Complete testing of VoLTE (Voice over Long-Term Evolution) and VoB (Voice over Broadband) by the end of FY19
• Complete installations of smart commercial meters across network by March 2020
• Accelerate 4G and 4G+ densifi cation to increase
coverage and double speeds, from 150 to 300 Mbps
• Achieve ISO 50001 certifi cation by March 2020
• Achieve a SUR of less than 15 minutes in FY19

• Enhance rural broadband by converting 100% of our physical sites to 3G enabled (currently at 96%)
• Accelerate installation of cyclic batteries and enhance battery cycling configuration
• Accelerate focus on renewable energy
• Improve energy effi ciency by converting sites from indoor to outdoor and replacing old R22 air conditioners with more energy-efficient inverter types and variable speed drive R410 air conditioners