
Safaricom Sustainability Report 2016
42
CHANGE IN FIBRE OPTIC NETWORK FOOTPRINT: FY14 TO FY16
We made good progress in terms of expanding our footprint,
laying an extra 1,226 kilometres of cables and connecting
13 more towns. Our fibre network is now 3,236 km in length
and connects 18 towns in 16 counties. We did not meet
our target of 1,020 enterprise buildings connected during
the year but grew the number of connected sites to 1,303
or 34% of the network. We only achieved 85% of our target
of 8,000 connected homes, however, and this will be an
area of concerted effort in the year ahead as we intend to
connect 20,000 residential homes.
Maintaining momentum in energy availability
The reliability and growth of our network is directly
dependent on the availability of energy. Any interruption in
energy supply, such as grid electricity outages and national
shortages of diesel fuel, poses a direct challenge to the
continuity of our operations. Consequently, energy security
and efficiency is ever more important as we look to expand
our network, particularly in rural areas that have less reliable
access to grid electricity.
Our response to this is primarily managed through our
energy failure rates (minimising energy outages at sites by
deploying a mix of energy supplies, including grid, generator
and alternative sources) and consumption targets (reducing
the amount of energy consumed at sites by deploying
more energy-efficient technologies and alternative energy
solutions).
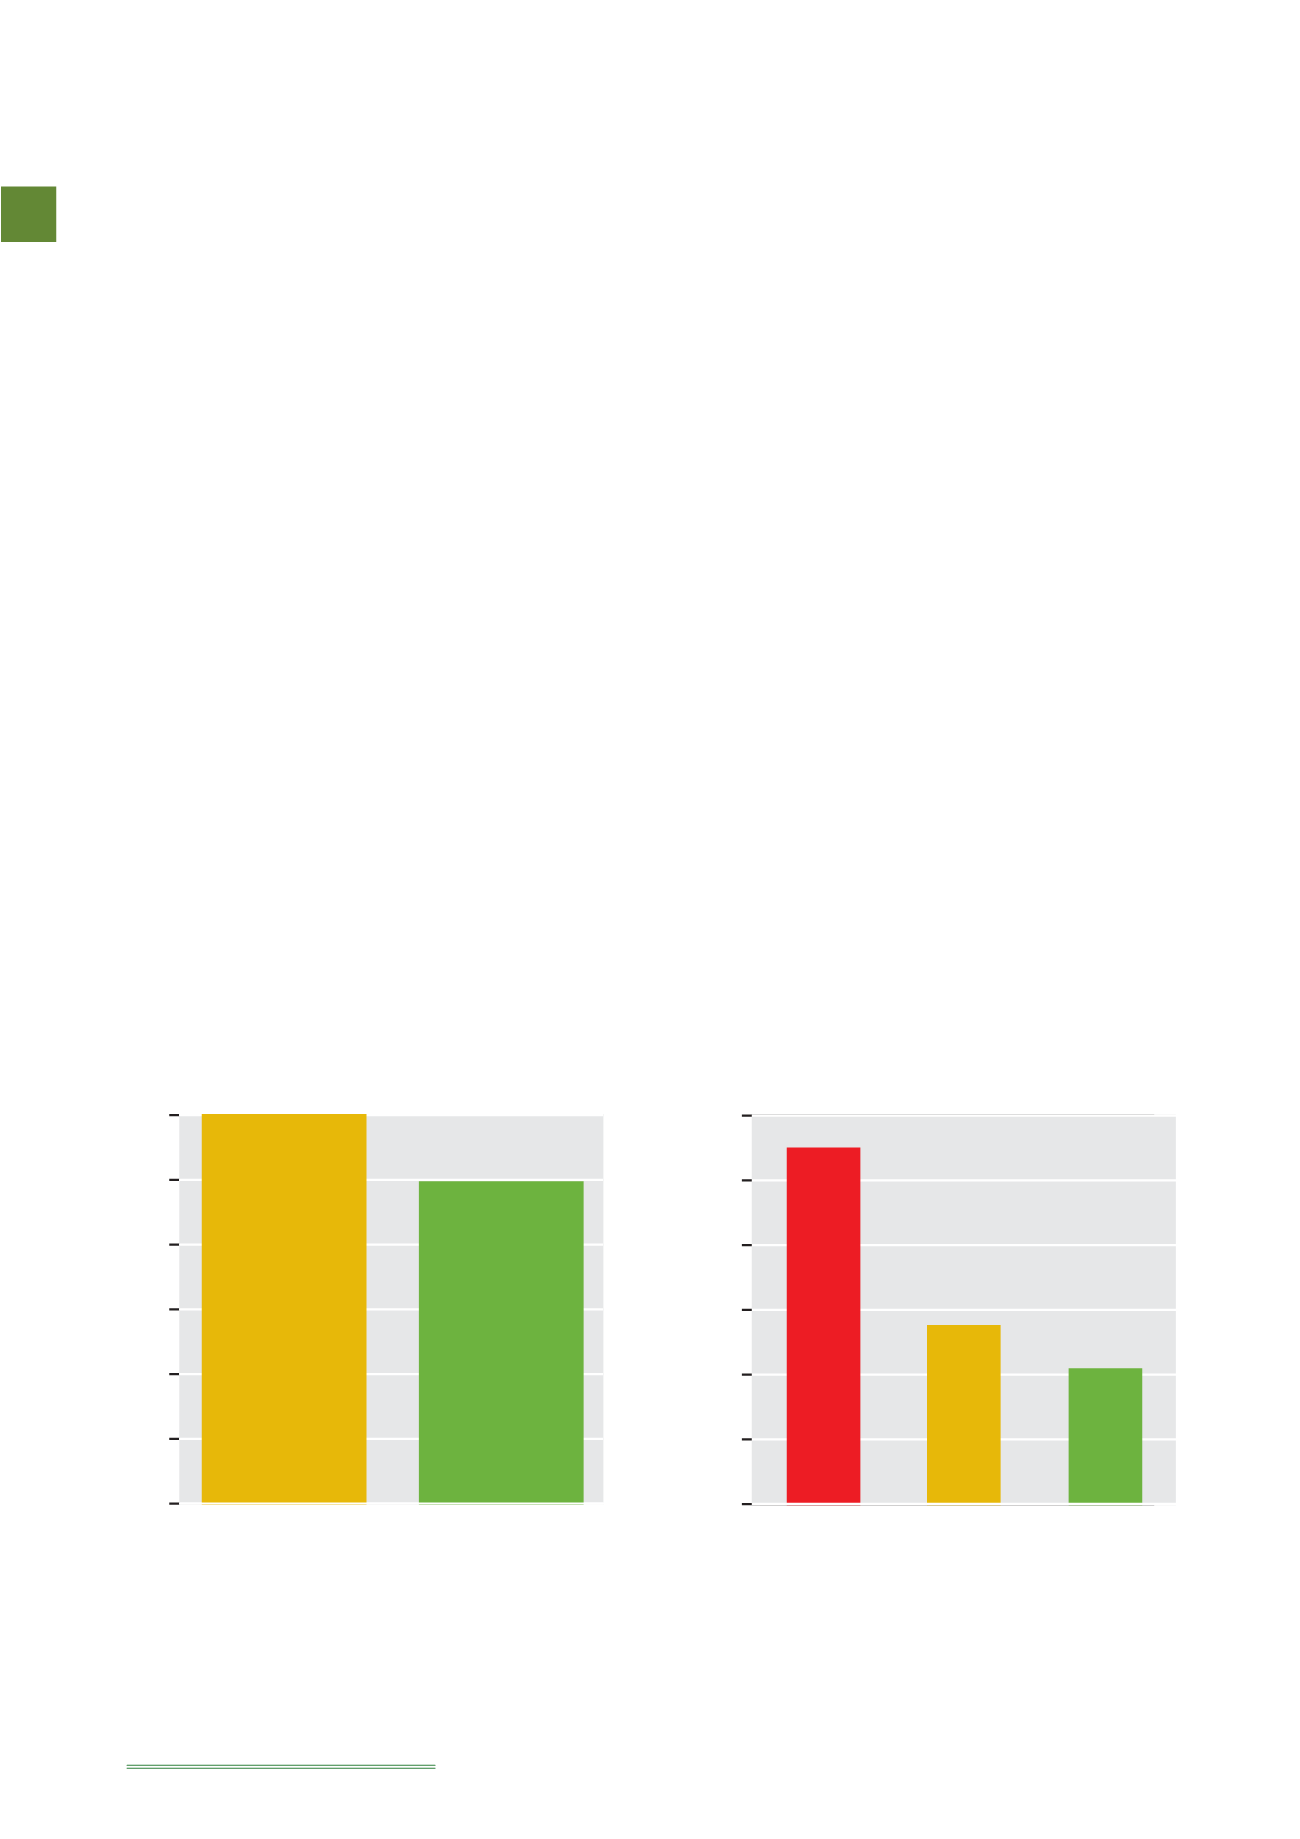
ENERGY AVAILABILITY
We calculate our network energy failure rate as the number
of minutes the network was unavailable as a result of power
outages. This is known as the Network Unavailability Rate
(NUR) and our target for the year was less than 5 minutes,
which we achieved.
We achieved our NUR target of less than 5 minutes as a
result of ongoing initiatives to manage the mix of energy
sources used throughout our network and ensure we have
suitable power redundancy and backup solutions in place.
Our network uses a variety of energy sources including
national grid, diesel generator, deep cycle battery and
renewable energy (solar, wind and hybrid) solutions. From an
energy-availability perspective, it was a year of maintaining
the momentum of FY15 and continuing with the same
initiatives. As our NUR shows, we have achieved a significant
improvement in resilience to national power outages and
to ensuring the network is available to customers in spite of
such episodes.
Keeping energy costs down while we source
new solutions
Our network continues to grow in size and sophistication
every year. As a result, making it more energy efficient
and intelligent remains an ongoing priority. Our vision is still
to create a powerful, streamlined network that uses the
minimal amount of energy to deliver its growing array of
services. One that transforms the lives of the communities it
serves with the lightest of environmental touches.
COST OF ENERGY CONSUMPTION BY SITE (KSh PER MONTH*)
*Energy consumed is electricity, diesel and solar. The sources are supplier
monthly fueling data and KPLC bills. Solar energy is only measured at some
sites, as such we have extrapolated the solar data to the other sites. Energy mix
influences the cost.
FY14
56,993
58,000
56,000
54,000
52,000
50,000
48,000
46,000
51,626
50,292
FY15
FY16
FY15
6
5
4
3
2
1
0
FY16
FY2014/2015
6.00
Average Weekly
Unavailable
Minutes
99.94%
Average
Availability
FY2015/2016
4.97
Average Weekly
Unavailable
Minutes
99.95%
Average
Availability


