Safaricom
  • TABLE OF CONTENTS
      • Safaricom at a glance
      • Our Ethiopian operations at a glance
      • ESG overview: Ethiopia
      • Message from our Chairman
      • Message from our CEO
      • Our Accolades in FY23
      • Our Corporate Strategy
      • Our Purpose Strategy
      • Our ESG Targets
      • Our Business Model
      • Our Contribuition to the UN SDGs
      • FY23 in Review
      • True Value Assessment
  • Search
  • Menu Menu

True Value Assessment

Since 2015, we have used a structured impact modelling tool – the KPMG ‘True Value’ methodology – to quantify the positive and negative impact of our organisation on society, the environment and the economy. True Value enables us to combine financial earnings data with monetized externality data and to quantify the likelihood and impact of the latter becoming the former. The ‘True Earnings’ bridge highlights both our resilience as a business and our strong fundamentals by showing that the total value we created for Kenyan society in FY23 was KSh 909.5 billion, approximately fifteen (14.6) times greater than the financial profit we made during the year. This year, our cumulative value-add to Kenyan society increased by 7.41% from FY22 to FY23.

The following is an independent analysis of Safaricom’s True Earnings by KPMG. KPMG’s True Value methodology quantifies the True Value to Profit ratio as True Earnings divided by financial profit. Safaricom’s True Value to Profit ratio has increased from 12.2×2 in FY22 to 14.6x in FY23. This fluctuation is largely driven by a 25% decrease in company profit and a 7.41% increase in True Earnings year-on-year. The increase in True Earnings is largely attributed to the value created for customers, agents and merchants through M-PESA (17% increase from 2022), as well as the growth in economic impact created through Safaricom’s CAPEX and OPEX during this financial year.

TRUE VALUE: IMPACT ON SOCIETY & ECONOMY
The True Value assessment calculates that Safaricom sustained over 236 674 direct and indirect jobs during the year and, if the wider (induced) effects on the economy are included, this number increases to over 1 159 309.

Impact on society

  • 14.6 times more than profit generated (profit of KSh 62.3 billion)
  • Total True Earnings (⮝7.41%)

Economic value added through operations

  • KSh 542 billion (⮝3.42%)

Social value M-PESA

  • KSh 325 billion (⮝17.66%)

Environmental externalities

  • KSh 1.14 billion (⮟4.27%)

DEFINITIONS

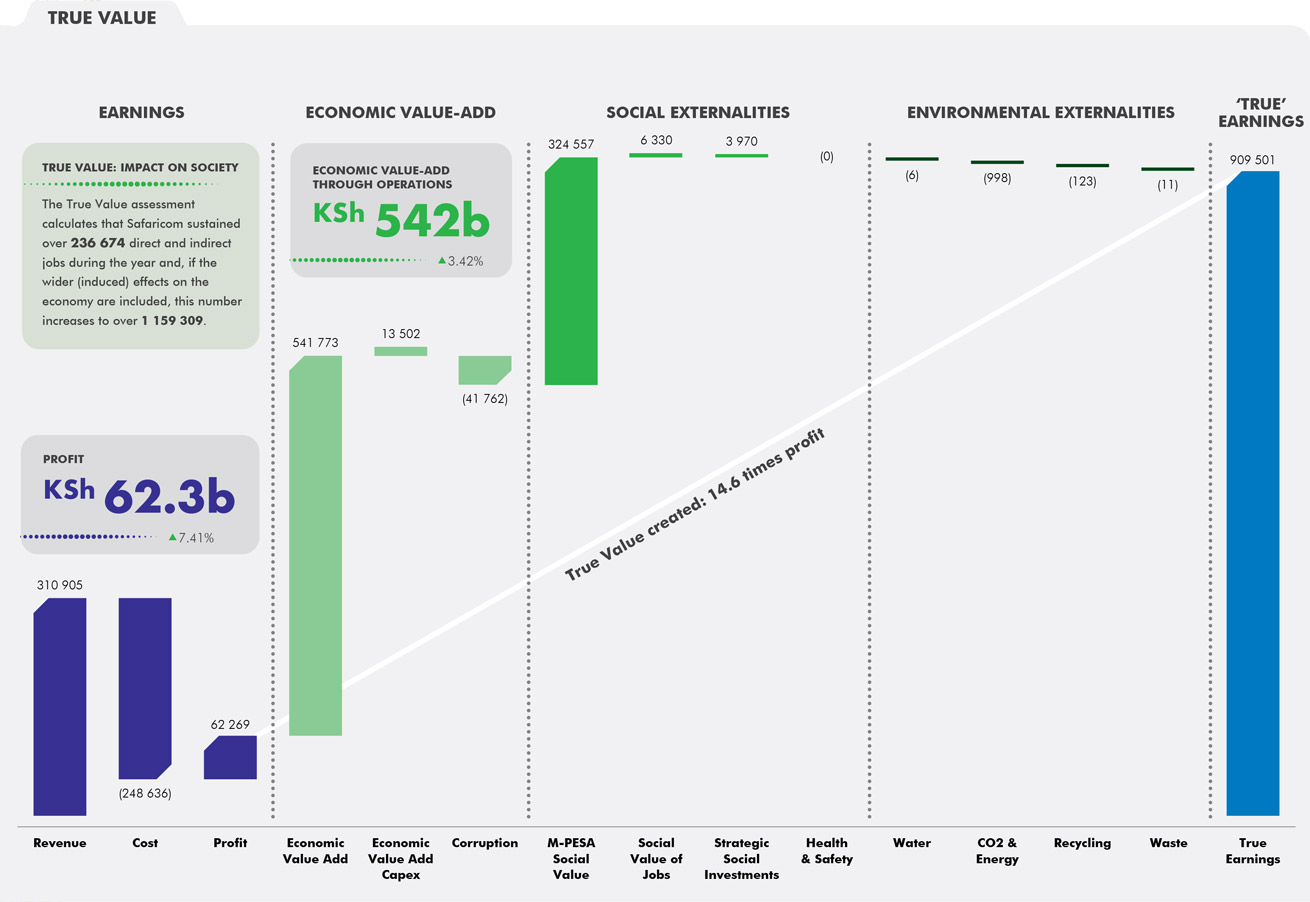
True Value: A three-step methodology that enables companies to (i) assess their ‘true’ earnings including externalities, (ii) understand future earnings at risk and (iii) develop business cases that create both corporate and societal value.

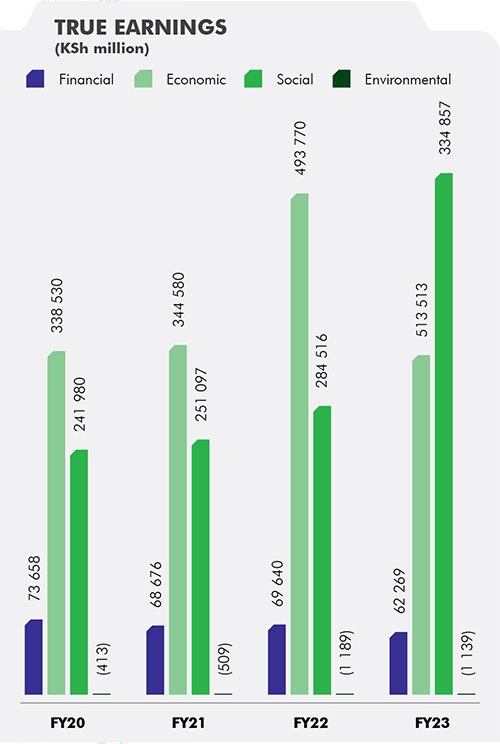
True Earnings: Monetization of the company’s externalities attributable to shareholders over and above profit. Total Economic Value: The nature and magnitude of the contribution Safaricom makes to the Kenyan economy. Direct Impact: Represents the additional gross value added to the Kenyan economy through our capital and operational expenditure capturing additional employment, income and trade.

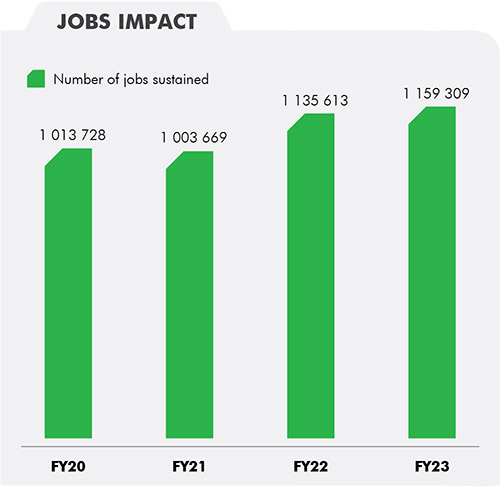
Indirect economic impact: Our direct expenditure also adds more widely to economic activity through the additional inputs purchased from suppliers. Initial demand for inputs results in heightened production and employment stimulating additional demand for goods and services along their own supply chains.

Induced economic impact: Our expenditure creates additional employment and benefits our suppliers’ employees. A proportion of the additional income generated in this way is spent on the consumption of goods and services. Through linkages and multiplier effects, this positively impacts the broader economy by stimulating additional demand for the products and services produced within the economy.

HOW WE ARRIVE AT THESE NUMBERS

Since 2014/15, Safaricom has used ‘True Earnings’ as a way of understanding and expressing the value that we create for society. KPMG first performed a True Earnings exercise for Safaricom in 2015 to identify our most material socioeconomic and environmental impacts and to quantify these in financial terms. Appropriate valuation factors were selected from KPMG’s comprehensive database which is sourced from global academic databases. Qualitative primary research enabled us to complete this exercise and to ascertain the social value created by our services, namely, M-PESA. To quantify this social value, principles from the Social Return on Investment (SROI) and Change Methodology principles are leveraged to quantify the social value created through M-PESA.

More detail regarding the 2014/15 True Earnings exercise can be accessed at: Safaricom_True_Value_brochure.pdf

Since the initial True Value assessment, assumptions were adjusted to reflect changes in the operating context and our product offerings. In 2020/21, the primary research was reperformed to ensure that the assessment accurately incorporates the impacts experienced by Kenyan society. Furthermore, the model utilises informed assumptions which are based on primary and secondary research. These assumptions are interrogated internally and confirmed to be the most appropriate within the specific Kenyan context. In future, we will need to continue to revise and update the model at specific intervals to reflect the changes in our operating context and the evolution of our product offerings.

TRUE EARNINGS

CARBON EMISSIONS

Carbon emissions released into the atmosphere have a direct negative impact on societies and the environment through the effects of climate change. Our emissions are assessed against the social cost of one ton of CO2e to quantify the value of erosion due to the company’s carbon footprint.

WATER

All businesses consume water, which in many regions is an essential, increasingly scarce resource with a broader social and economic value that exceeds the tariff paid for it. To quantify the value eroded through water consumption, the True Value Methodology quantifies the commercial consumption of water against the social cost of water, water scarcity and water stress. The 2023 quantification of Safaricom’s water consumption has been updated to represent the social cost of water within Kenya based on recent literature.

WASTE

Waste disposal has a negative cost to society. The quantification of this impact is based on the social cost of handling one ton of waste within a region. Although recycling allows for waste to be reused, there is still a negative cost to society related to the production of materials from recycled content. By analysing the waste categories applicable within a business, the KPMG True Earnings Bridge can quantify the value eroded due to waste generation. The 2022 quantification of Safaricom’s waste consumption has been updated to represent the social cost of waste within Kenya based on more recent literature.

This chart shows year-on-year movements in our value creation across the scoped impacts (economic, social and environmental). Most noteworthy was the growing contribution from social externalities, particularly through the social value created by M-PESA which grew since 2022. Economic value created through Safaricom’s operations and capital projects resulted in the greatest value creation during 2023. Economic impact increased by 4%3 since FY22. The value created

through operational and capital expenditure increased by 3.42%2 and 2.54%, respectively in 2023. This was anticipated as the overall capital expenditure for FY23 increased by 13%. Though recognised as a material topic, value erosion through environmental externalities, continues to have minimal impact.

OUR ENVIRONMENTAL VALUE-ADD

The overall negative environmental impact on Safaricom’s ‘True Earnings’ decreased by 4.27% from FY22. The largest contributor to this value erosion was carbon emissions which decreased by 7.1%. This was primarily due to a decrease in Scope 1 emissions following the rollout of solar power and energy efficiency improvements. Additionally, a 2.5% increase in Scope 3 emissions can be attributed to increased air travel during FY23.

Last year, we increased the scope of reporting to the regions where our regional offices, retail shops and Mobile Switching Rooms (MSRs) are located. The KPMG True Value assessment further updated financial proxies to align to more a current representations of impact assessments related to water in Kenya.

In FY23, total e-waste and office waste collected and recycled amounted to 96.6% of the total solid waste. The remaining 1.4% composed of waste to landfill. This could not be recycled as it included items like diapers and face masks which pose threats to health. Waste incinerated amounted to 2.1%. KPMG updated the quantification of waste based on best practice. Waste quantifications were based on the social cost of handling one ton of waste within a region.

OUR IMPACT ON SOCIETY

This year, there were no recorded fatalities. Additionally, we have had half as many loss-time injuries compared to last year.

During FY23, M-PESA created KSh 325 billion worth of societal value – a 17.66% year-on-year increase – reflecting our efforts to provide relevant solutions to our customers. The major drivers of this growth were the increase in the numbers of customers and the average number and value of transactions made per customers, a significant increase in the number of merchants, the increase in the value of transactions made through agents. The greatest value continues to be felt by customers, who benefit from their improved ability to manage and save money, lower transaction costs and reduced levels of theft resulting from not having to carry cash. Enhanced wellbeing comes with access to goods, services and opportunities as well as feelings of heightened safety and security.

We aim to further transform lives by improving the well-being of our customers, agents, and merchants as the M-PESA service evolves over time.

OUR ECONOMIC VALUE-ADD

The graph on the following page provides a high-level overview of the annual contribution we made to employment. The numbers are derived from a Kenya-specific Economic Impact Assessment (EIA) model and include direct and indirect contribution to employment, as well as the induced wider effects of employment in the economy. The positive social impact associated with the direct and indirect jobs sustained because of Safaricom has been included in the True Earnings bridge.

The economic impact of the KSh 311 billion in annual revenue generated from Safaricom’s operations resulted in an estimated KSh 660.9 billion contribution to Kenya’s Gross Domestic Product (GDP). This impact can be separated into a direct impact of KSh 173.2 billion, an indirect impact of KSh 121 billion and an induced impact of KSh 366.7 billion.

The total economic impact of Safaricom’s KSh 40.4 billion capital expenditure resulted in a total GDP contribution of KSh 22.9 billion. This GDP impact can be separated into a direct impact of KSh 9.7 billion, an indirect Impact of KSh 3.8 billion and an induced impact of KSh 9.4 billion.

The ‘Total Economic Value added’ on the Safaricom True Earnings Bridge only includes the direct and indirect GDP impact associated with Safaricom’s operations and capital expenditure.

Each year, a portion of the economic value generated by Safaricom is lost owing to corruption in Kenya. It is important to note that this is not directly connected to Safaricom’s activities, but rather acknowledges the unfortunate reality that not all this value is retained.

All financial information can be found in the 2023 Annual Financial Report, including taxes paid and actual direct employment. Both capital and operational expenditure have been processed via the Kenyan national economic impact assessment model, structured to incorporate the economic structure of the communications industry according to the Kenyan Social Accounting Matrix (SAM).

View as an e-book Download PDF

PREVIOUS REPORTS     |    ANNUAL REPORTS

SAFARICOM HOUSE | Waiyaki Way, Westlands PO Box 66872, 0800 Nairobi

Tel: +254 722 00 4524/4260 | www.safaricom.co.ke

Please share any comments, queries or suggestions you have with the reporting team by emailing sustainability@safaricom.co.ke

Scroll to top